3 Results
3.1 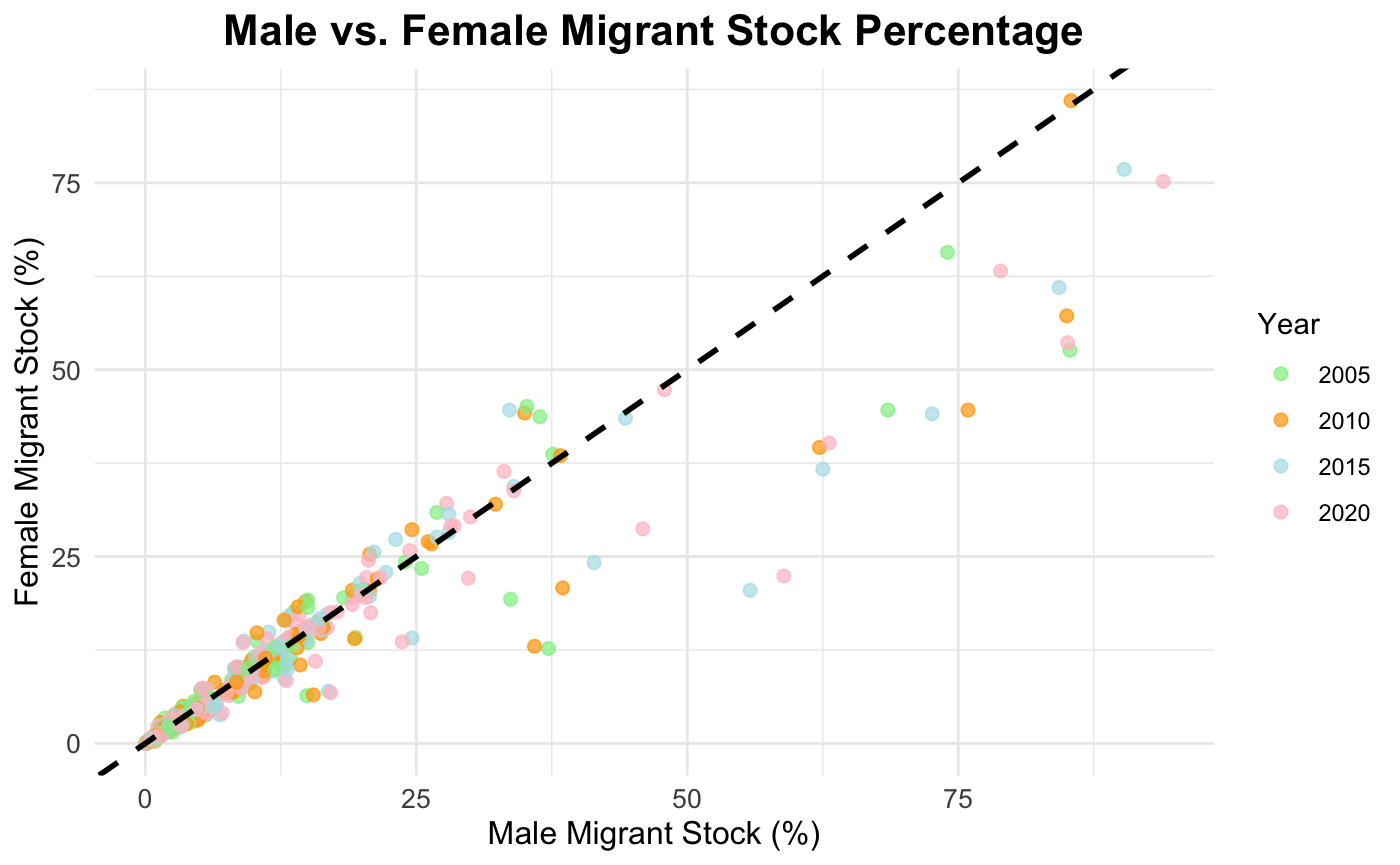
This scatter plot examines the relationship between male and female international migrant stocks as a percentage of the total population. It provides insight into the gender distribution of migration patterns across different years.
3.1.1 Key Observations:
Positive Correlation:
The data shows a strong positive correlation between male and female migrant stocks, as indicated by the clustering of points along the dashed equality line (black). This suggests that countries with higher male migrant stocks tend to have correspondingly higher female migrant stocks.Temporal Trends:
Points are color-coded by year (2005, 2010, 2015, and 2020), enabling visualization of migration patterns over time. While no significant year-to-year shifts are evident, subtle variations in migration behavior are observed.Outliers:
Some points deviate significantly from the equality line, representing countries where the proportion of male and female migrants is imbalanced. These outliers likely reflect specific geopolitical or cultural factors influencing gendered migration patterns.
3.2 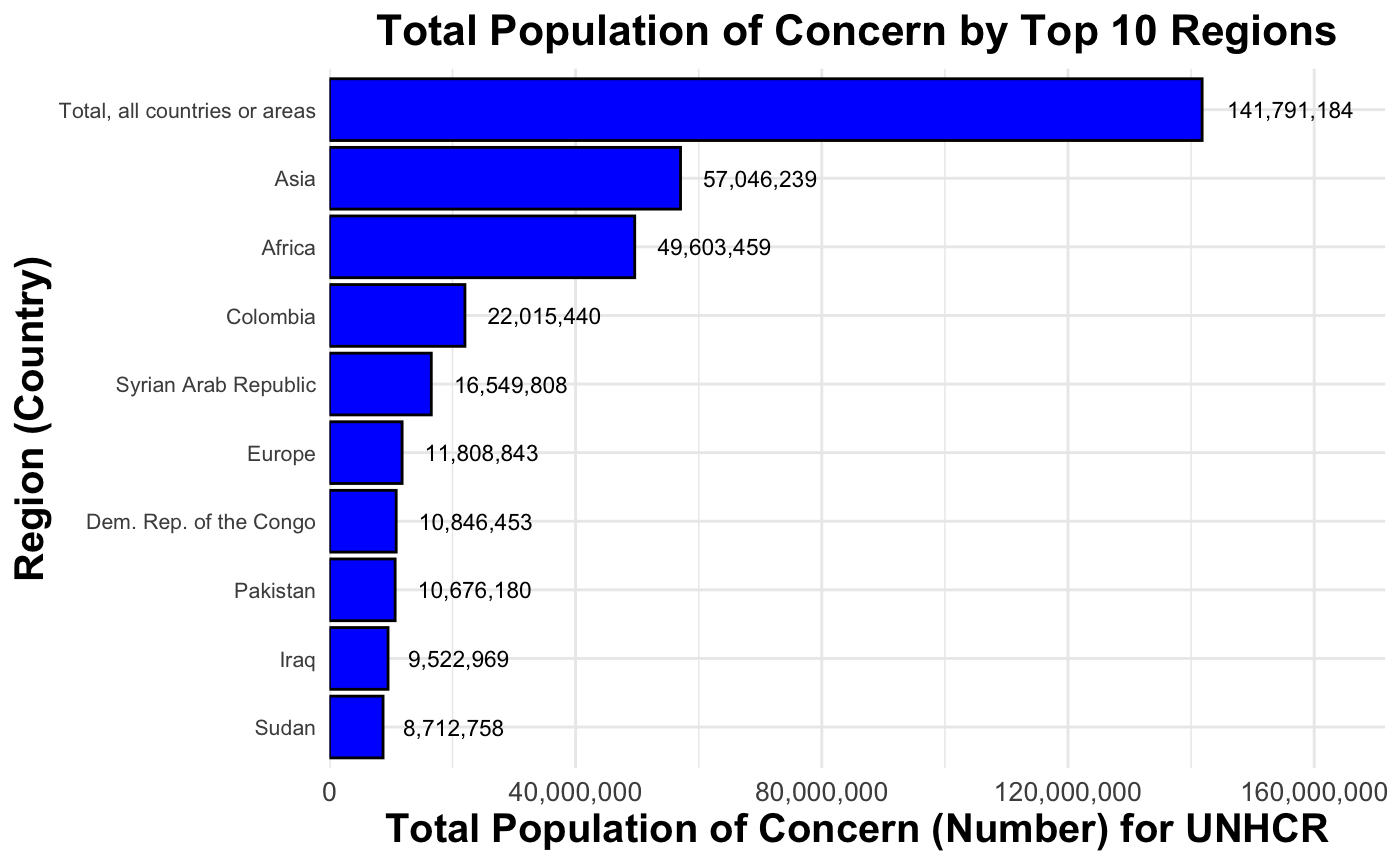
This bar chart presents the total population of concern to the UNHCR across the top 10 regions, ranked by their respective values. The visualization highlights significant contributors, aiding in targeted analysis and resource allocation.
3.2.1 Key Findings:
Dominant Regions:
Asia and Africa contribute the highest numbers, with Asia surpassing 57 million and Africa exceeding 49 million. Other regions, such as Colombia, the Syrian Arab Republic, and Europe, also show substantial populations of concern.Total Context:
Combined, the global figures exceed 141 million, illustrating the UNHCR’s vast operational scale.
3.2.2 Highlights:
- Understanding Global Disparities:
The chart underscores significant differences in populations of concern across regions, clarifying priority areas for attention. - Policy and Resource Allocation:
It identifies regions requiring urgent intervention, enabling stakeholders to make informed decisions. - Ease of Interpretation:
Precise numerical labels and organized rankings enhance clarity and usability.
3.3 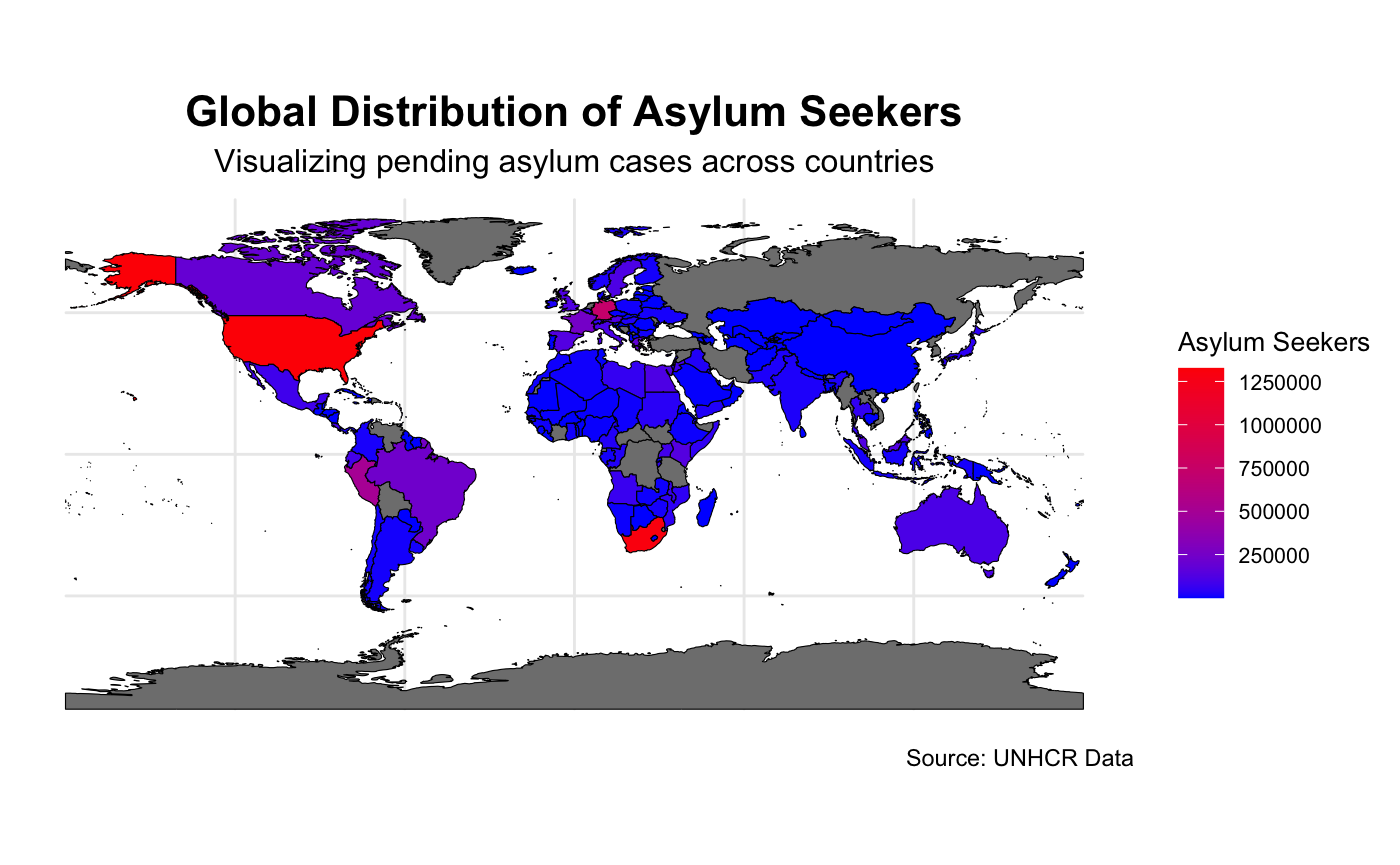
The map is a visually appealing and accurate representation of the global distribution of asylum seekers. The gradient color scheme from blue to red effectively highlights regions with varying magnitudes of asylum seekers. The map provides a clear and intuitive understanding of the data.
3.3.1 Predicted Trends and Observations:
Regional Concentrations:
High concentrations of asylum seekers are observed in North America and parts of Europe, attributed to their political and economic stability.Disparities in Distribution:
Significant numbers are also observed in countries across Africa and the Middle East, driven by ongoing conflicts and humanitarian crises.Migration Patterns:
The data suggests that asylum seekers predominantly target developed nations or regions geographically closer to conflict zones.
3.4 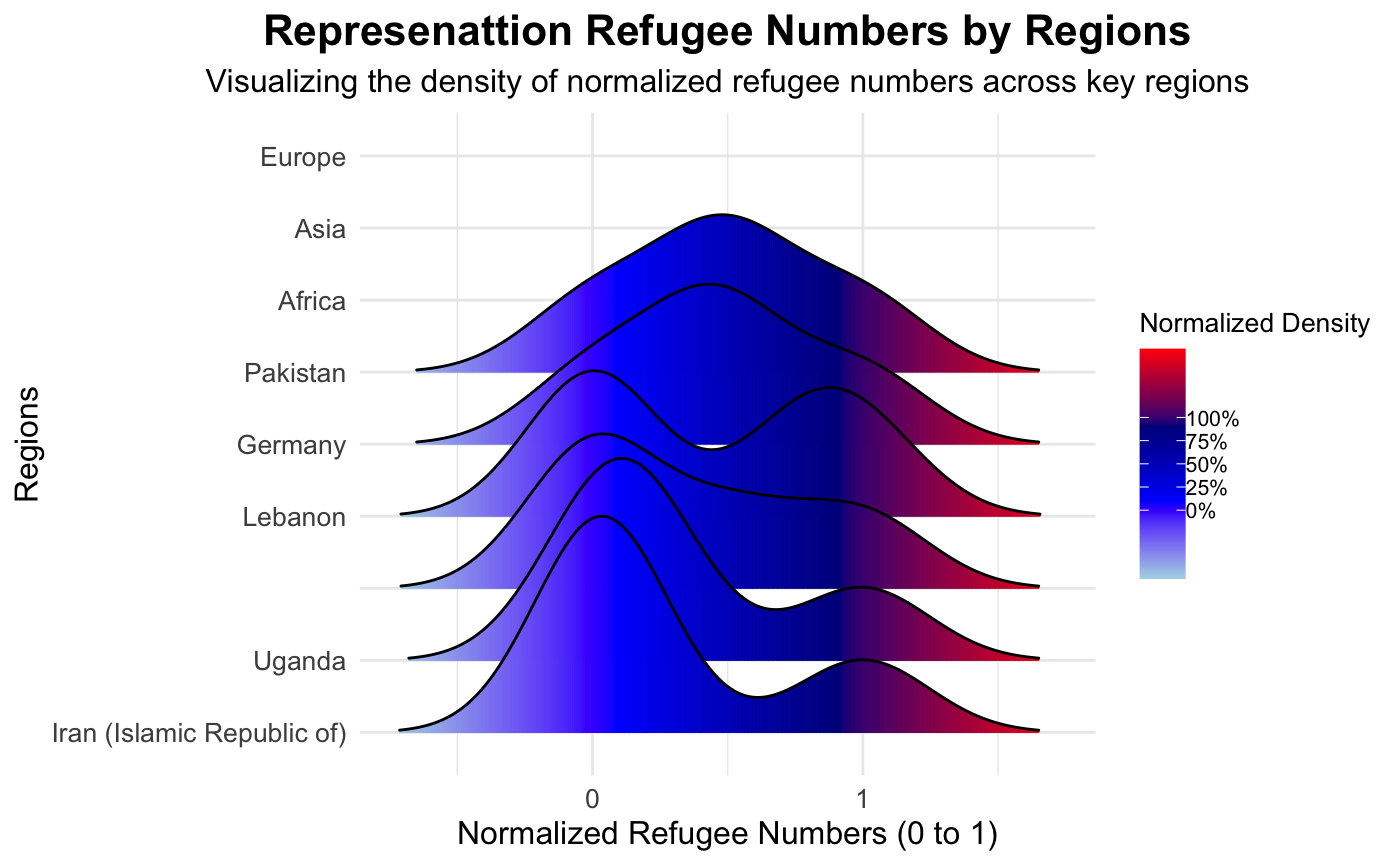
The ridgeline plot visualizes the normalized refugee numbers across different regions.
3.4.1 Key Insights:
- Regional Leaders:
Europe shows the highest density of normalized refugee numbers, hosting the largest population relative to its total population. - Significant Peaks:
Countries like Pakistan, Germany, and Lebanon stand out for hosting disproportionately high refugee populations. - Disparities:
Regions such as Uganda and Iran exhibit lower normalized refugee numbers.
3.5 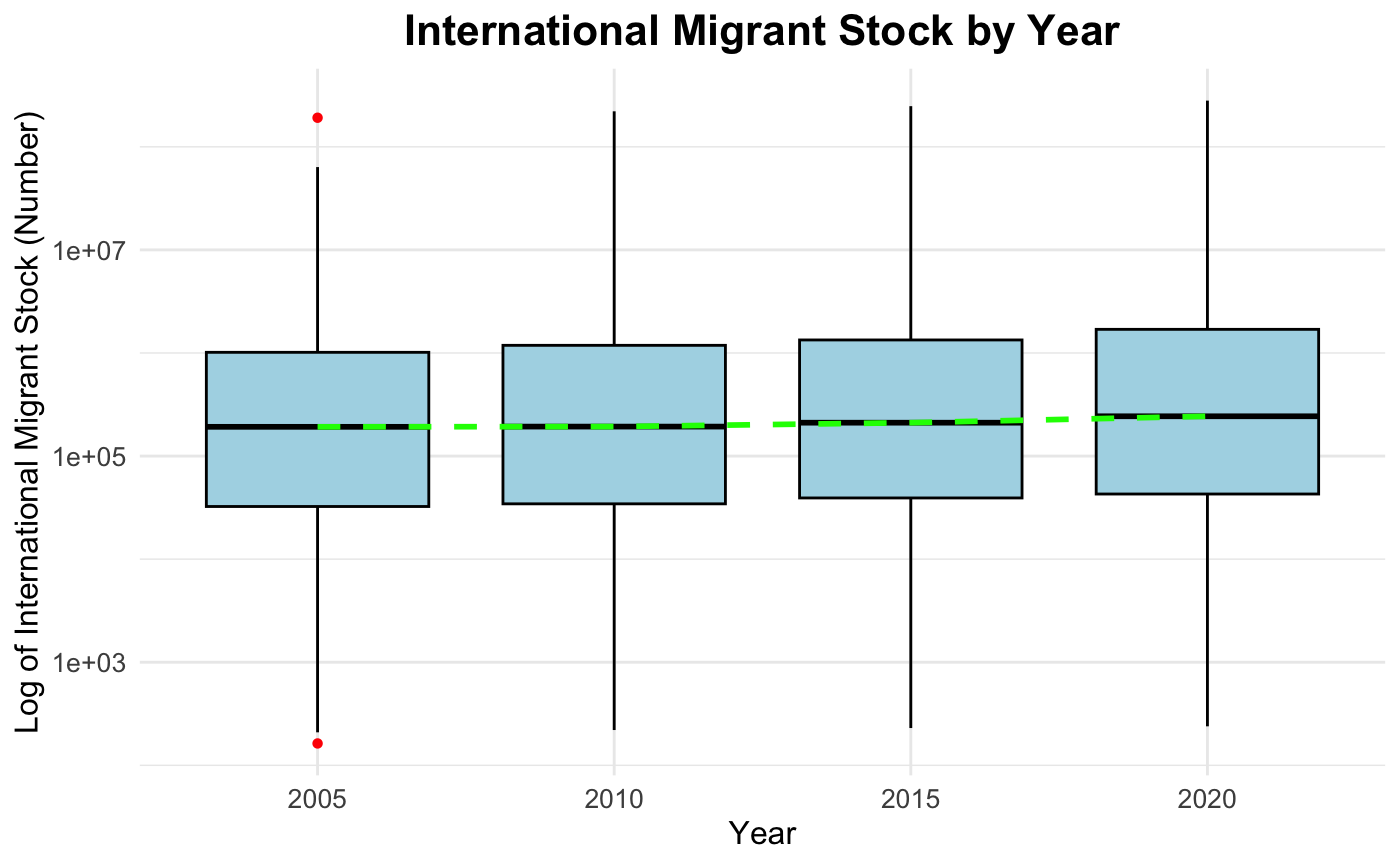
This boxplot visualizes the distribution of international migrant stock (both sexes, in numbers), as given in our dataset across different years, using a logarithmic scale for better clarity. The following insights can be drawn:
This boxplot visualizes the distribution of international migrant stock (both sexes, in numbers) across different years, using a logarithmic scale for better clarity.
3.5.1 Key Findings:
- Stable Migration Trends:
Median values indicate relatively stable patterns over the years, with only slight variations. - Outliers:
Red points highlight countries with exceptionally high migrant stocks in specific years. - Central Tendencies:
The dashed green line connecting medians shows consistent trends over time.
3.6 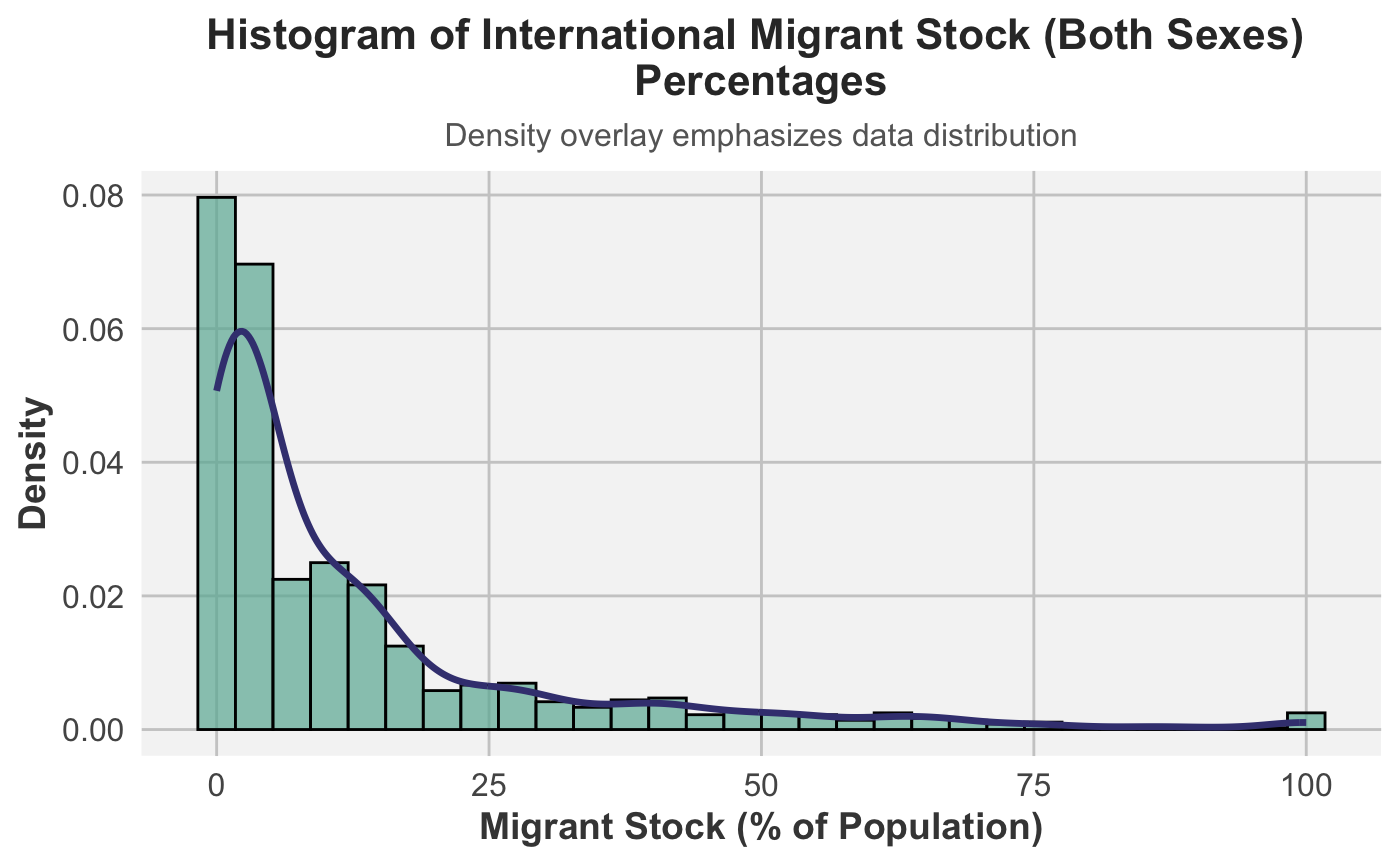
This histogram shows the distribution of international migrant stock as a percentage of the total population.
3.6.1 Observations:
- Right-Skewed Data:
Most countries have a migrant stock below 10% of their population, with a few outliers nearing 100%. - Density Overlay:
The concentration of values at the lower end highlights the relatively low proportion of migration in most countries.
3.7 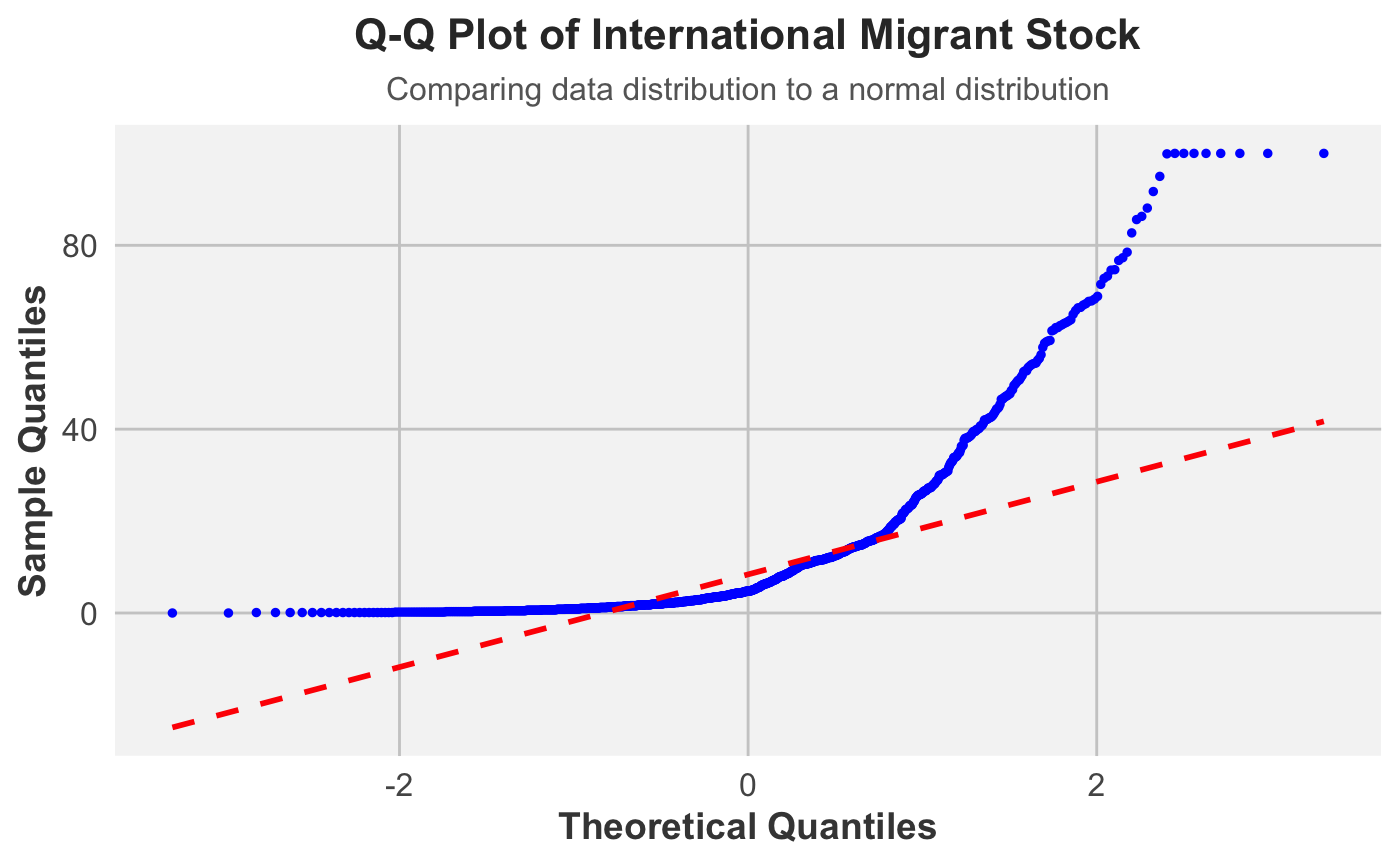
The Q-Q plot compares the distribution of international migrant stock to a theoretical normal distribution.
3.7.1 Key Findings:
- Right-Skewed Distribution:
Significant deviation from the red diagonal line in the upper quantiles confirms the skewed nature of the data. - Shapiro-Wilk Normality Test:
The test result (W = 0.68905, p-value < 2.2e-16) confirms that the data is not normally distributed.
3.8 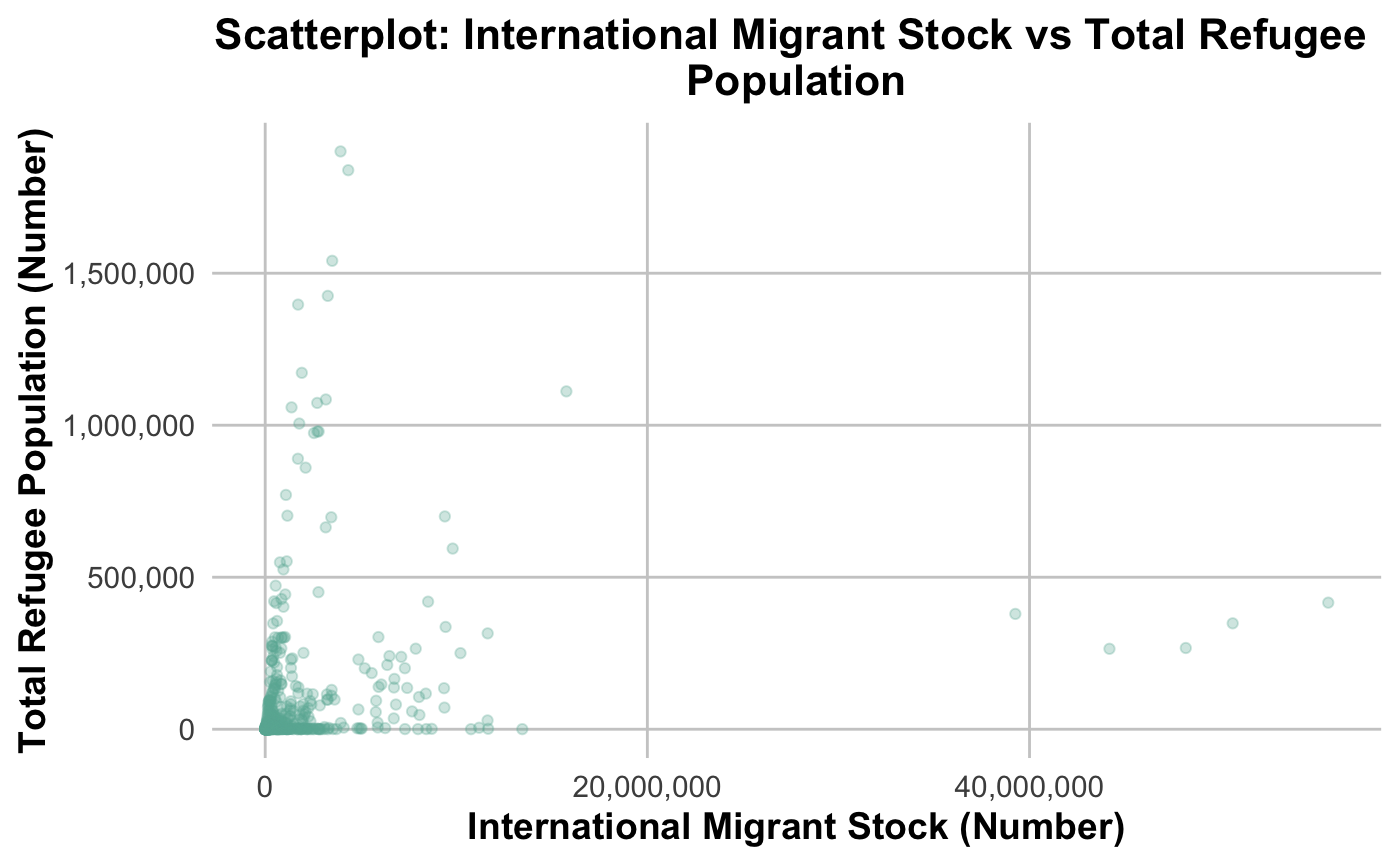
This scatterplot examines the relationship between international migrant stock and total refugee population.
3.8.1 Insights:
- Clustered Data:
Most countries have low values for both metrics, clustering near the origin. - Outliers:
A few countries with extremely high migrant or refugee populations deviate significantly, suggesting unique roles in global migration.
3.9 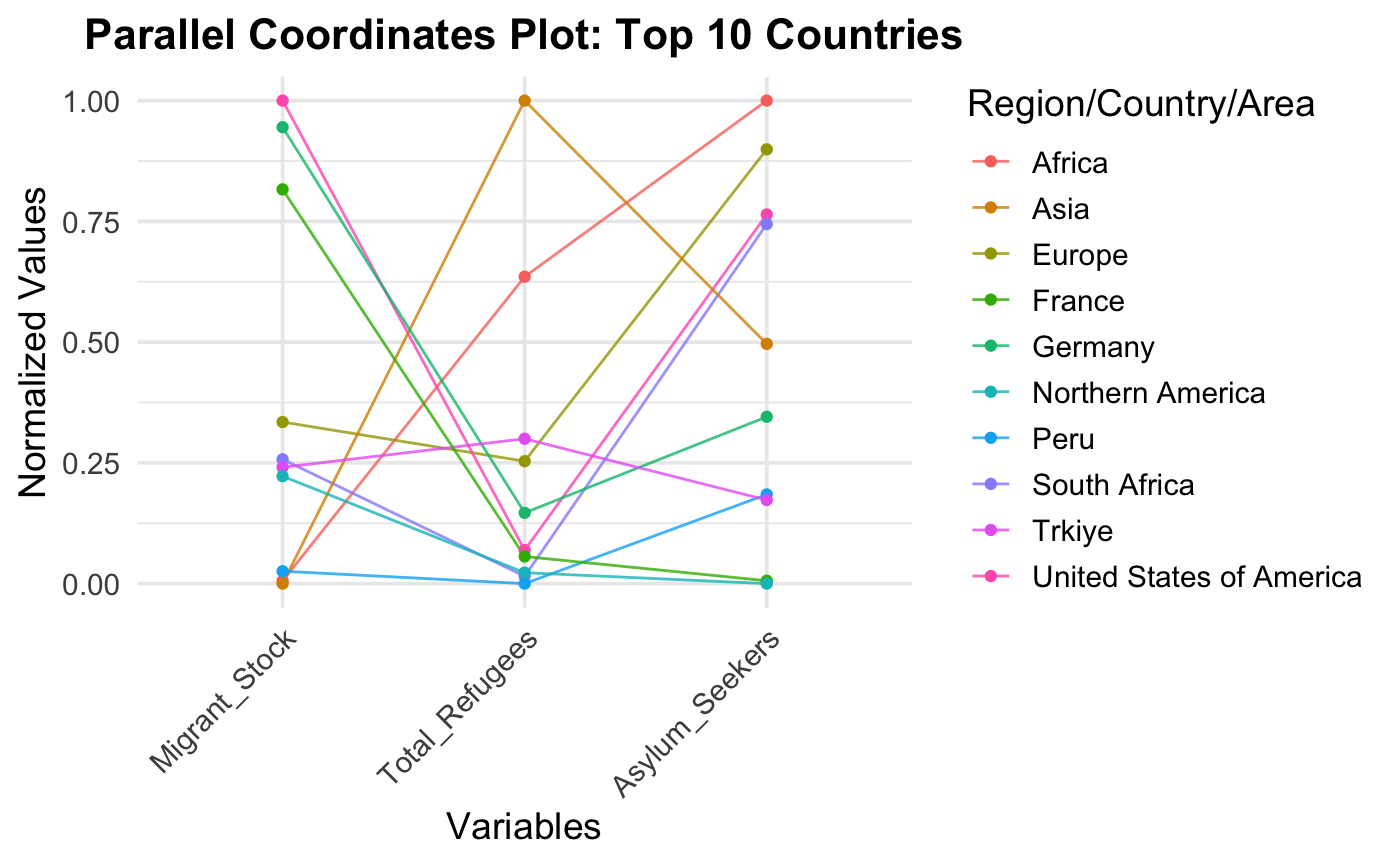
This parallel coordinates plot visualizes normalized values of migration metrics (Migrant Stock, Total Refugees, and Asylum Seekers) for the top 10 countries. The lines show significant variability across metrics for different countries. For example, some regions like “Northern America” and “United States of America” have high migrant stock but relatively lower refugee populations. Conversely, regions like “Africa” and “Asia” show higher refugee numbers but lower migrant stocks. This highlights the differing roles countries play in migration dynamics—some as destinations for migrants and others as hosts for refugees.
3.10 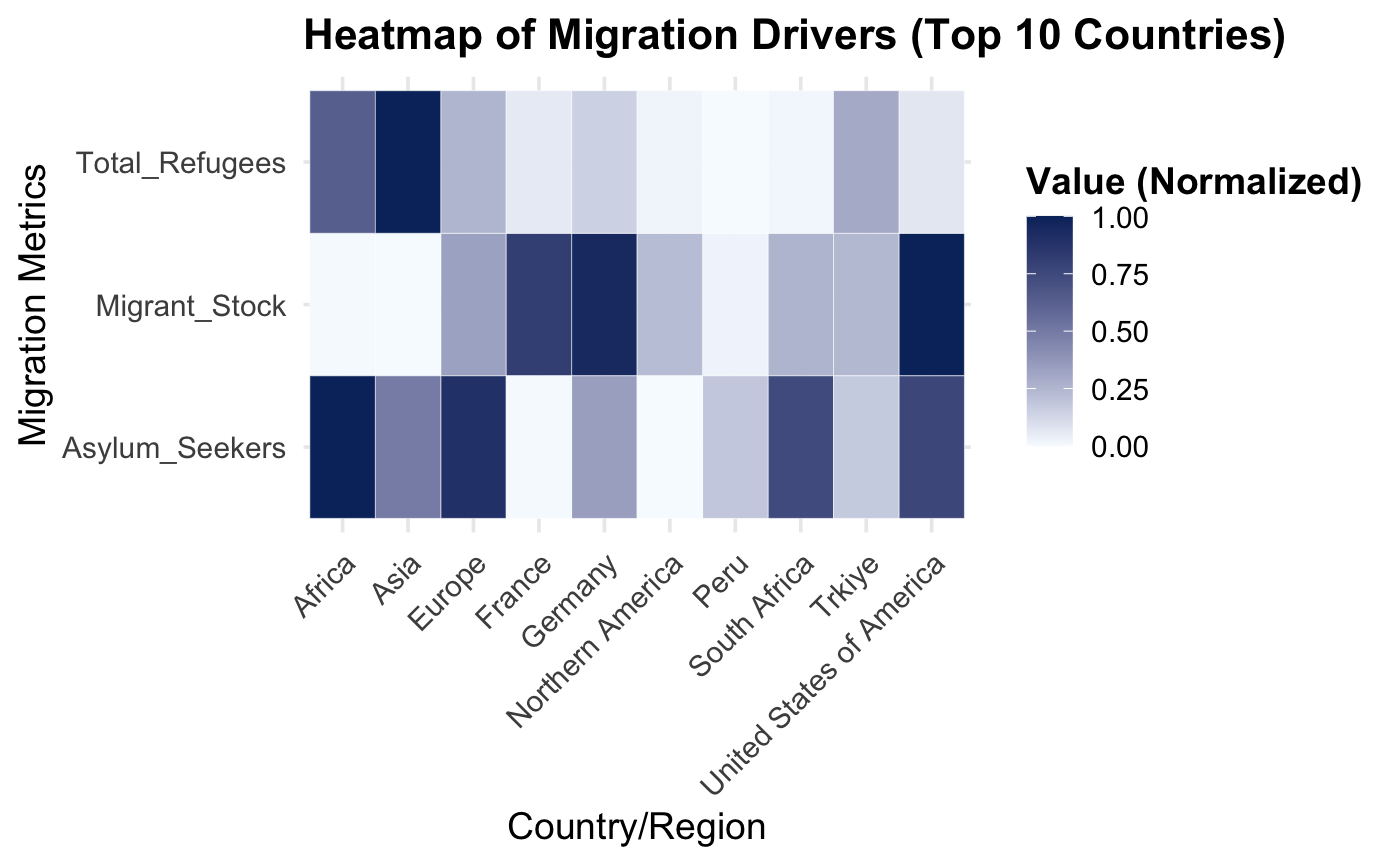
The heatmap highlights migration metrics across the top 10 countries/regions using darker shades to indicate higher values.
3.10.1 Insights:
- Uneven Distribution:
The United States and Northern America exhibit high migrant stocks, while Africa and Asia show higher refugee populations. - Variability in Asylum Seekers:
Some regions host significantly more asylum seekers than others.